![]()
k8spacket - packets traffic visualization for kubernetes

What’s new in version 2.0.0
k8spacket doesn’t use the gopacket library nowadays and is fully based on  now!
now!
Read the article on medium.com k8spacket — a fully based on eBPF right now
It uses
inet_sock_set_statetracepoint to get information about TCP connections inside the cluster- traffic control and queueing discipline filters on ingress and egress to collect information about TLS handshake process
To use k8spacket v2.x.x, the minimum required kernel version is 5.4 with enabled BTF.
See e2e tests README
New features:
- Dashboard
k8spacket - TLS certificate expirationshows the remaining time until the certificates expire. By variablePast interval to analyze, you can narrow or expand the scope of data to analyze. Data sorted by expiring earliest first. It’s easy to build alerts based on the certificate expiration date. See more raw metrics in the dashboardk8spacket - TLS metrics
- Two principal
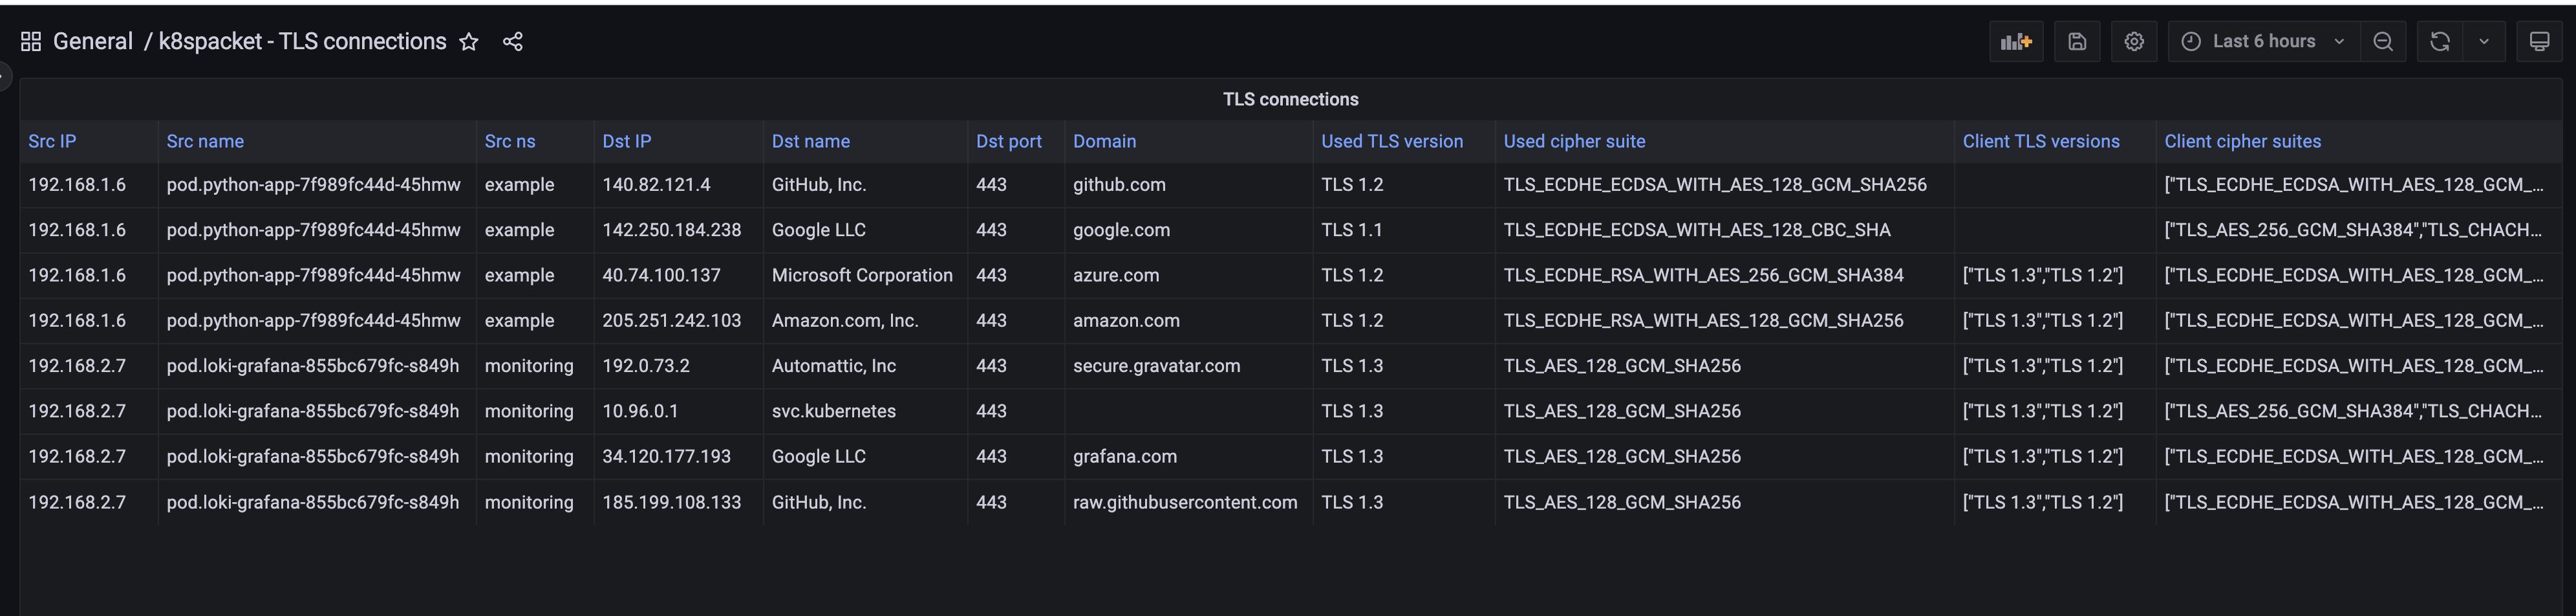
k8spacketdashboards (k8spacket - node graphandk8spacket - TLS connections & certificates) are sensitive to Grafana time range control now. You can show cluster TCP traffic or TLS connections, f.e., for the last 5 minutes
What’s new in version 1.1.0
tls-parserplugin can get information about the server certificate chain (TLS versions less than 1.3)- dashboard about TLS connections has changed to show server certificate chain details (depends on
marcusolsson-json-datasourceandmarcusolsson-dynamictext-panelGrafana plugins)
What’s new in version 1.0.0
- architecture of k8spacket changed to use
go plugins(see available plugins here: https://github.com/k8spacket/plugins) - added the plugin with metrics about the TLS handshake process inside and outside the cluster (TLS version and cipher suite used)
- added a dashboard with TLS metrics
- added a dashboard about TLS connections
- IP and name of TLS client
- domain, IP, and port of TLS server
- supported TLS versions and cipher suites by the client
- chosen TLS version and cipher suite by the server
k8spacket helps to understand TCP packets traffic in your kubernetes cluster:
- shows traffic between workloads in the cluster
- informs where the traffic is routed outside the cluster
- displays information about closing sockets by connections
- shows how many bytes are sent/received by workloads
- calculates how long the connections are established
- displays the net of connections between workloads in the whole cluster
k8spacket uses Node Graph API Grafana datasource plugin. See details Node Graph API plugin
Installation
Install k8spacket using helm chart (https://github.com/k8spacket/k8spacket-helm-chart)
  helm repo add k8spacket https://k8spacket.github.io/k8spacket-helm-chart
  helm repo update

  helm install k8spacket --namespace k8spacket k8spacket/k8spacket --create-namespace
Add Node Graph API and JSON API plugins and datasources to your Grafana instance. You can do it manually or change helm values for the Grafana chart, e.g.:
grafana:
  env:
    GF_INSTALL_PLUGINS: hamedkarbasi93-nodegraphapi-datasource,marcusolsson-json-datasource,marcusolsson-dynamictext-panel
  datasources:
    nodegraphapi-plugin-datasource.yaml:
      apiVersion: 1
      datasources:
        - name: "Node Graph API"
          jsonData:
            url: "http://k8spacket.k8spacket.svc.cluster.local:8080/nodegraph"
          access: "proxy"
          basicAuth: false
          isDefault: false
          readOnly: false
          type: "hamedkarbasi93-nodegraphapi-datasource"
          typeLogoUrl: "public/plugins/hamedkarbasi93-nodegraphapi-datasource/img/logo.svg"
          typeName: "node-graph-plugin"
          orgId: 1
          version: 1
    marcusolsson-json-datasource.yaml:
      apiVersion: 1
      datasources:
        - name: "JSON API"
          url: "http://k8spacket.k8spacket.svc.cluster.local:8080/tlsparser/api/data"
          access: "proxy"
          basicAuth: false
          isDefault: false
          readOnly: false
          type: "marcusolsson-json-datasource"
          typeLogoUrl: "public/plugins/marcusolsson-json-datasource/img/logo.svg"
          typeName: "json-api-plugin"
          orgId: 1
          version: 1
Fill additional scrape config to observe Prometheus metrics:
    - job_name: "k8spacket-metrics"
      metrics_path: /metrics
      scrape_interval: 25s
      static_configs:
      - targets: [k8spacket.k8spacket.svc.cluster.local:8080]
Add dashboards configmap to Grafana stack
kubectl -n $GRAFANA_NS apply --recursive -f ./dashboards
Usage
Go to k8spacket - node graph in Grafana Dashboards and use filters as below
Select graph mode (connection, bytes, duration)
Filter by namespace
Filter by include or exclude workflow name